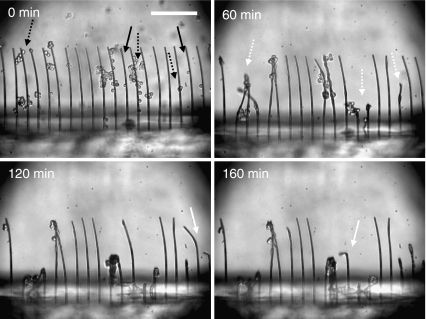
Fig. 7.
Time-lapse microscope images of fiber buckling for 6-μm fibers. Black-line arrows indicate cells right before cell adhesion. White dashed-line arrows indicate the beginning points of buckling by multiple cells, and white solid-line arrows indicate the beginning points of buckling by single cells. The numbers in top-left corners indicate the elapsed time. Scale bars: 200 μm

