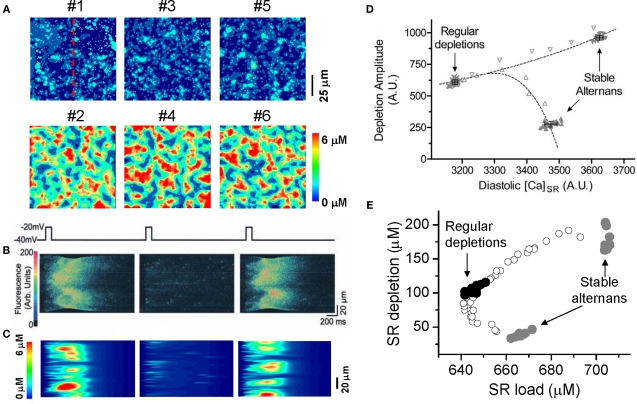
Figure 10.
Ca alternans from a CRU network model. (A) Ca distribution in the cytoplasmic space at the peak each beat for the six alternating beats (Rovetti et al., 2010). (B) A time–space plot (line scan) of optical signal showing Ca alternans from an experiment by Diaz et al. (2004). (C) A time–space plot of Ca from the simulation in B. The scanned line is marked in A. (D) SR depletion versus load using a “ramp pacing” by Picht et al. (2006). (E) The simulation data using a similar pacing protocol. In the simulations, the system was first paced with PCL = 500 ms for 20 beats and exhibited stable alternans (gray dots), and then increased PCL gradually (open dots), until PCL = 2000 ms at which the system exhibited regular Ca release with no alternans (black dots). For each PCL, Ca depleted from the SR was plotted against the SR Ca content right before the stimulation. In the experiment by Picht et al., the pacing frequency was decreased from 2.2 Hz (stable alternans) to 1.5 Hz (regular depletions).

