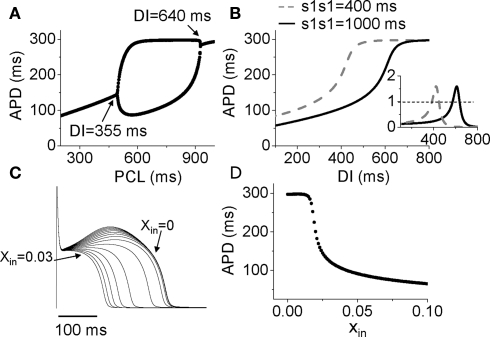
Figure 6.
Mechanisms of Ito induced alternans. (A) A bifurcation diagram by APD versus PCL. (B) APD restitution curves for two different S1S1 intervals. Inset shows the slopes of the two APD restitution curves. (C) Action potentials for different initial values of x (xin = 0 to 0.03). (D) APD versus the initial values of x (xin).

