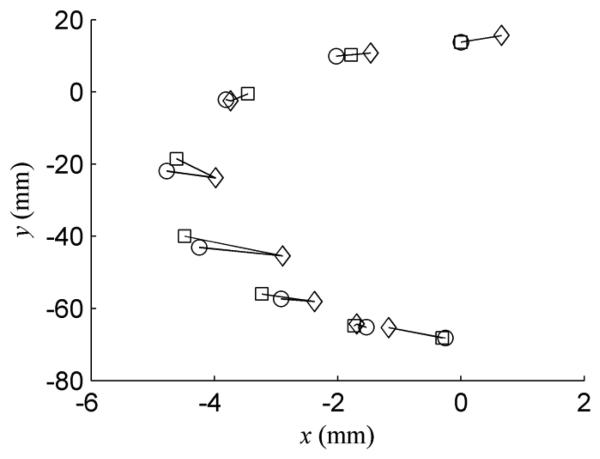
Fig. 9.
Tip position in the x-y plane for robot loaded with 200 g in the −y direction. Data points correspond to unloaded robot curvature varying from the configuration of Fig. 5 to zero and then to the configuration in which robot is curved downward. Diamonds are measured positions; circles are the multi-tube model predictions; squares are the single-tube model predictions. Associated positions are connected by lines.

