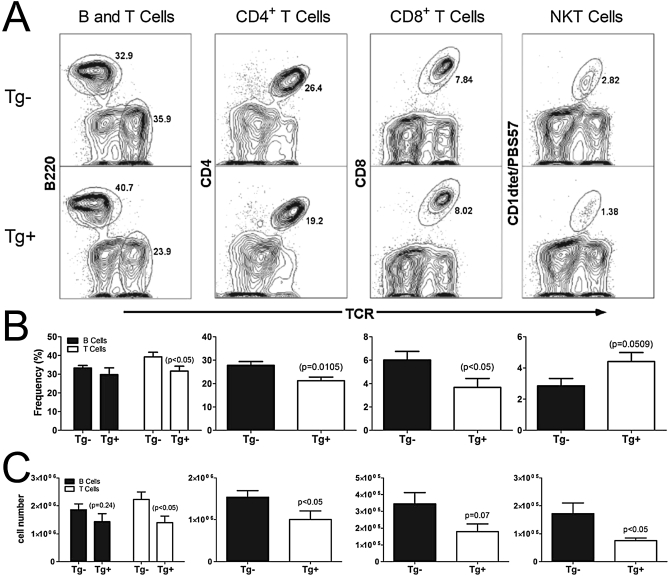
Figure 5.
Lymphocyte populations within the lung after Aspergillus fumigatus antigen sensitization and challenge. Lung digests were performed from CC10-IDO transgenic mice (Tg+) (bottom histograms) and transgene-negative littermates (Tg−) (top histograms) that had been sensitized and challenged with A. fumigatus antigens. Flow cytometry was performed to determine the frequency of B cells, T cells, CD4+ T cells, CD8+ T cells, and natural killer T (NKT) lymphocytes found within the lymphocyte population. Below the representative histograms (A), graphs display the frequency of cells as determined from the gated lymphocyte parent population (B), and cell numbers were calculated from the frequency multiplied by the lymphocyte numbers in the lungs (C). Data from 10 Tg+ and 8 Tg− mice/group (± SEM) are presented in the graphs below the representative histograms.

