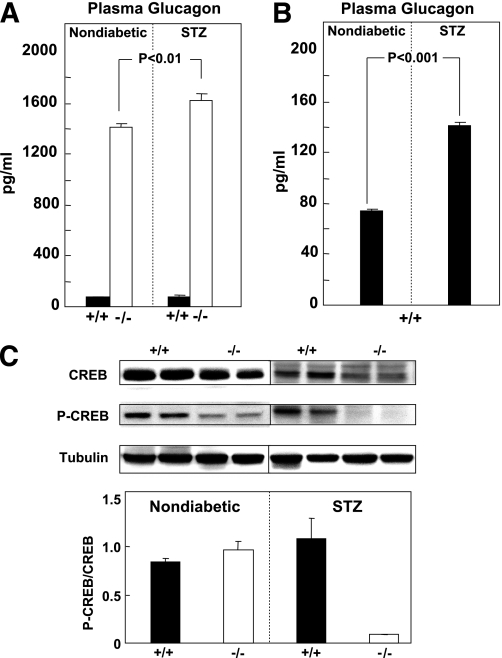
FIG. 1.
A: Comparison of plasma glucagon levels in Gcgr+/+ (■) and Gcgr−/− (□) mice before and 6 weeks after STZ induction of β-cell destruction. B: Glucagon in Gcgr+/+ mice before and after STZ. C: Representative immunoblots for CREB and P-CREB in livers of Gcgr+/+ (■) and Gcgr−/− (□) mice after β-cell destruction by treatment with STZ and in untreated controls (upper panel). The P-CREB/CREB ratio in densitometric units in six Gcgr+/+ (■) and six Gcgr−/− (□) mice after β-cell destruction by treatment with STZ (lower panel).

