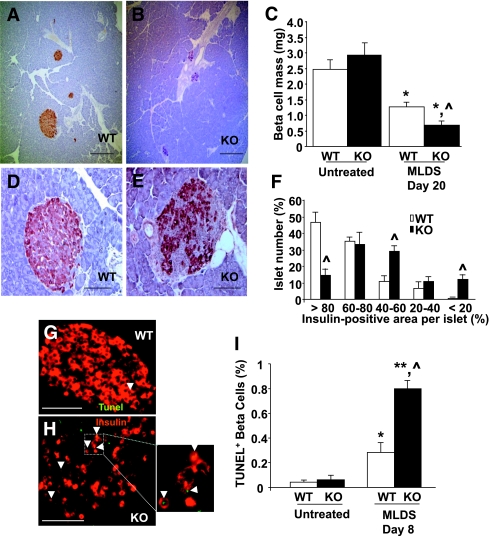
FIG. 4.
Decreased β-cell mass and increased β-cell death in PancMet KO mice treated with MLDS. A and B: Representative photomicrographs of pancreas sections obtained from MLDS-treated mice (day 20) stained for insulin (brown) and counterstained with hematoxylin. Scale bar = 200 μm. C: Histomorphometric quantitation of β-cell mass in three pancreatic sections per mouse separated by 50 μm and stained for insulin. Pancreata were harvested at day 20 after MLDS from PancMet KO (n = 5) and WT (n = 10) mice. D and E: Photomicrographs of representative islets from PancMet KO and WT littermates treated with MLDS and stained for insulin. Scale bar = 50 μm. F: Percentage of islets with insulin-positive areas ranging from >80 to <20% assessed in three pancreatic sections from WT (n = 10) and PancMet KO mice (n = 5) 20 days after MLDS treatment. G and H: Representative photomicrographs of islets from PancMet KO and WT littermates at day 8 after treatment with MLDS and stained for insulin (red) and TUNEL (green). Scale bar = 50 μm. A higher magnification photo of an area in the pancreas of PancMet KO mice is displayed on the right side of H. Arrows indicate TUNEL-positive β-cell nuclei. I: Quantitation of TUNEL-positive β-cell nuclei in pancreatic sections from PancMet KO (n = 5) and WT (n = 5) mice treated with MLDS and harvested at day 8. *P < 0.05 and **P < 0.01 vs. untreated and ^P < 0.05 vs. WT. (A high-quality digital representation of this figure is available in the online issue.)

