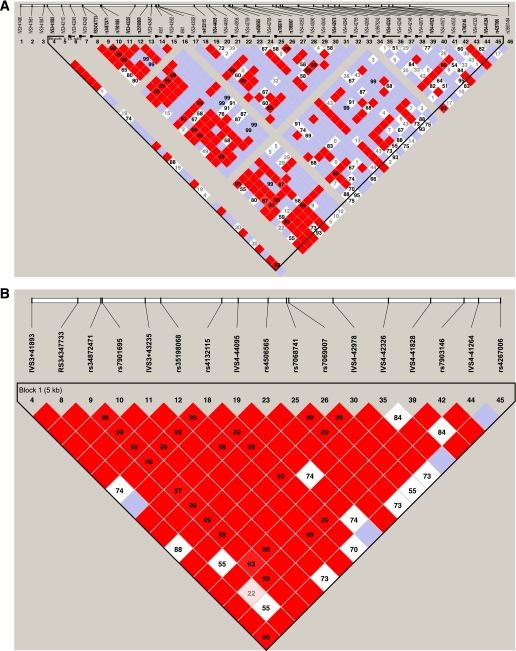
FIG. 2.
A: Haploview-generated LD map of the 40 SNPs identified by direct sequence analysis (C10:114742846–114750274) in African American controls (n = 1,106). Regions of high LD (D′ = 1 and logarithm of the odds [LOD] >2) are shown in dark red. Markers with lower LD (0.45 < D′ < 1 and LOD >2) are shown in dark through light red, with the color intensity decreasing with decreasing D′ value. Regions of low LD and low LOD scores (LOD <2) are shown in white. The number within each box indicates the r2 value. B: Haploview-generated LD map of the 17 common SNPs (MAF >0.05) identified by direct sequence analysis (C10:114742846–114750274) in African American controls (n = 1,106). Regions of high LD (D′ = 1 and LOD >2) are shown in dark red. Markers with lower LD (0.45 < D′ < 1 and LOD >2) are shown in light red, with the color intensity decreasing with decreasing D′ value. Regions of low LD and low LOD scores (LOD <2) are shown in white. The number within each box indicates the r2 value. (A high-quality color representation of this figure is available in the online issue.)

