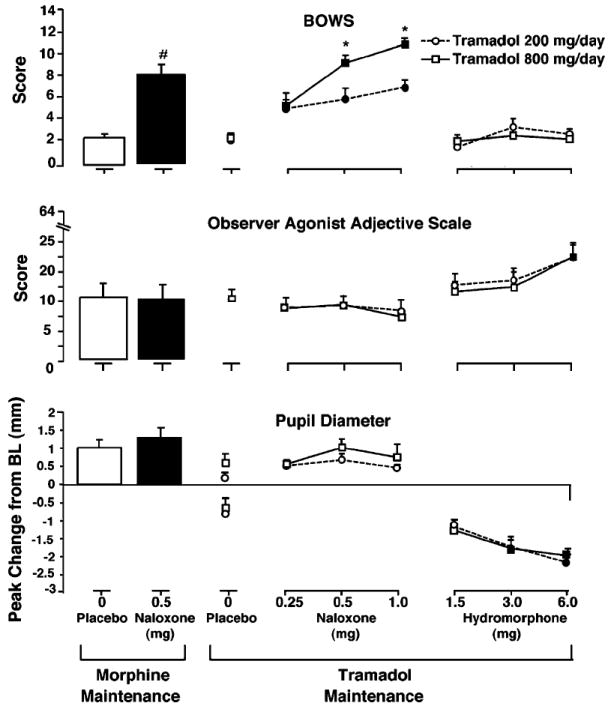
Fig. 2.

Mean peak scores on the BPRU opioid withdrawal scale (BOWS) and observer agonist adjective scale are shown in the top and middle panels, respectively. Mean peak increase (above abscissa) and decrease (below abscissa) from baseline in pupil diameter is shown in the bottom panel. Results following IM placebo and naloxone challenges during SC morphine maintenance are shown on the left, and results following IM naloxone and hydromorphone challenges during 200 and 800 mg/day oral tramadol maintenance are shown on the right. Tramadol 200 mg/day is represented by circles, and tramadol 800 mg/day is represented by squares. A number sign indicates a significant difference from placebo following naloxone challenge during morphine maintenance. A darkened symbol indicates a significant difference from placebo during tramadol maintenance, and an asterisk indicates a significant difference between tramadol dosing conditions. Statistical significance was set at p<0.05. Vertical bars represent the SEM
