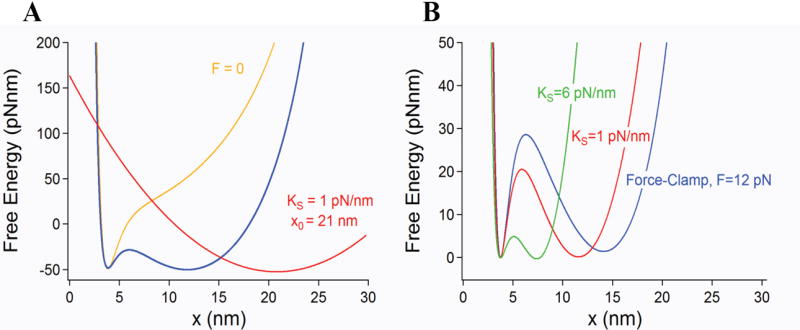
Figure 4.

Free energy of a single molecule perturbed by an harmonic potential. This is the most typical experimental configuration both for optical tweezers and AFM experiments. A) A force probe modeled as a harmonic potential (red trace) is moved along the pulling coordinate x at a velocity ν. The harmonic potential of the probe deforms the free energy of the relaxed molecule (yellow trace) creating an entropic barrier (blue trace) that is similar but smaller than that obtained under constant force conditions. B) The magnitude of the resulting barrier is dependent on the curvature of the potential (spring constant) of the pulling probe. The figure shows barriers calculated for ks=1 (red) and 6 (green) pN/nm which are always smaller and shorter than that obtained under force–clamp conditions. The barriers are compared under conditions where the entropic and enthalpic minima have approximately the same energy at F1/2. As the spring constant of the probe is increased, the magnitude of the entropic barrier decreases and the distance between the entropic and enthalpic minima also becomes shorter. This is caused by the changing curvature of the perturbing potential which has a large influence on the shape and size of the resulting entropic barrier. The largest barrier is encountered under force-clamp conditions where it becomes independent of the linkers and spring constant of the probe.
