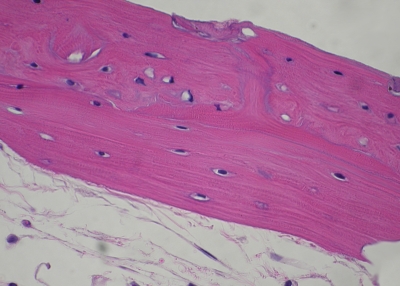
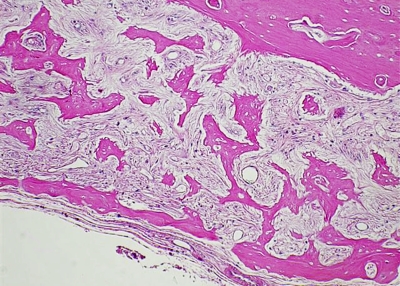
Fig. 4-A Fig. 4-B.
Figs. 4-A and 4-B Hematoxylin-eosin sections (original magnification, ×400). Fig. 4-A Representative sample from Group 1, in which more than 50% of the lacunae are filled with normal osteocytes and the sample exhibits normal bone morphology. Fig. 4-B Representative sample from Group 2, showing very few osteocyte-holding lacunae and grossly altered bone morphology with cortical necrosis and absent peritrabecular lining.


