
Fig. 1.
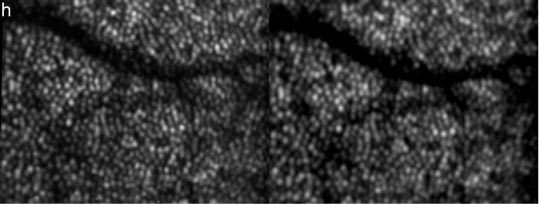
First frame of a movie (Media 1 (3MB, AVI) ) showing intensity fluctuations in depth integrated OCT (left) and SLO (right) images of cone photoreceptors within 7 hours (image extension: ~0.94°x0.7°, retinal eccentricity: ~4° nasal from the fovea)