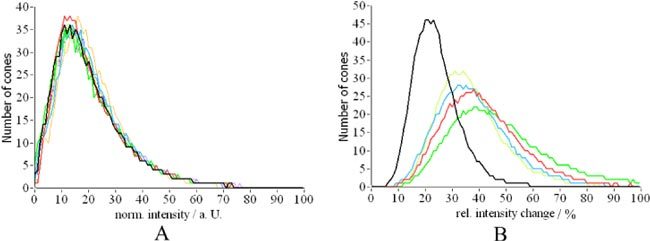
Fig. 9.

A) Distribution of backscattered intensity of individual cones (colors correspond to different measurement times). B) Relative intensity variation (normalized by the average intensity retrieved from each layer) over time of cones for individual retinal layers (black depth integrated intensity, red IS/OS junction, green OS, blue ETPR, yellow RPE).
