Fig. 14.

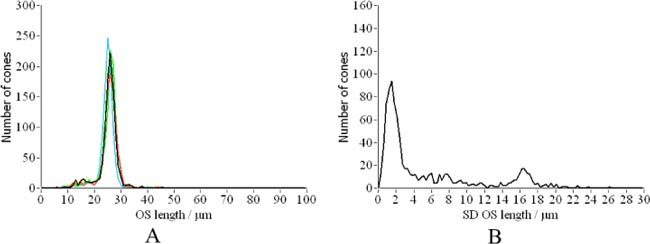
A) Distribution of cone outer segment lengths for each day (corresponding to different colors). B) Distribution of standard deviations calculated over the whole measurement period.

A) Distribution of cone outer segment lengths for each day (corresponding to different colors). B) Distribution of standard deviations calculated over the whole measurement period.