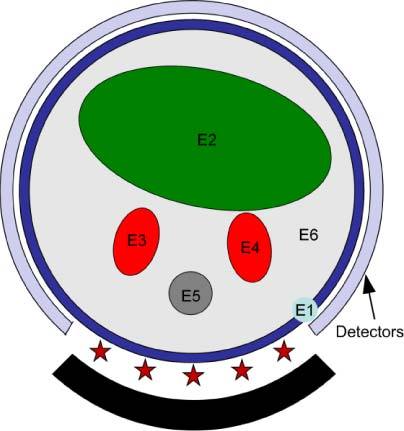
Fig. 1.

Schematic of the object used in the simulation illustrating 6 different regions: E1 is the skin, E2 is the bowel, E3 and E4 are the kidneys, E5 is bone and E6 is adipose tissue. The source-detectors setup is also shown in the figure; 5 sources indicated by the star uniformly distributed in a field of view of 90°. 121 detectors forming an approximately 270° of view; the total number of data readings is 5x121 = 605 for DOT and FT. The total number of reading used for BLT is 3 (wavelengths) x121 which is 363.
