
Fig. 6.
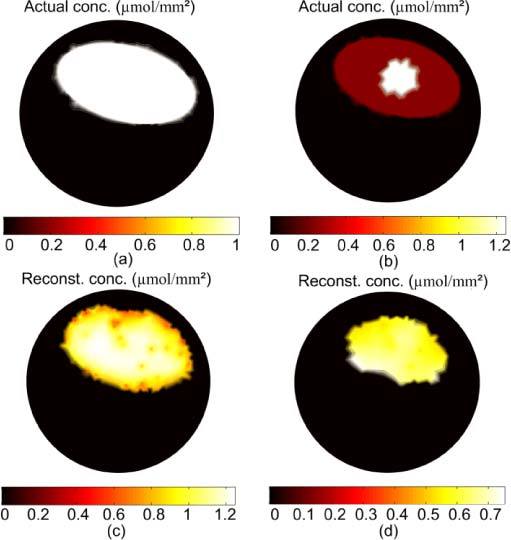
FT reconstruction of a large distributed fluorophore source that fills the gut region. The concentration of the actual sources in (a) is 1 µmol/mm2, and the reconstructed source is shown in (c). For the nonuniform source in (b), the reconstructed source in (d) shows almost uniform magnitude and smaller size than the true source.