
Fig. 4.
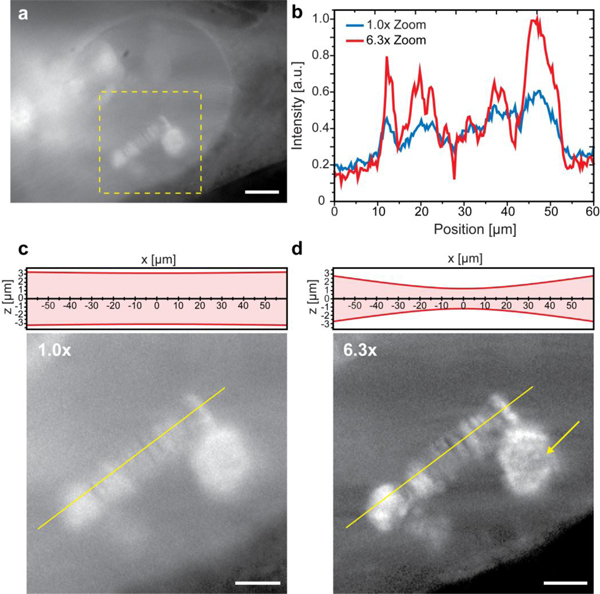
Live imaging with different zoom configurations. Polytene chromosomes of C. tentans larvae salivary gland cell nuclei imaged at different zoom factors. (a) Overview image at zoom 1.0x of the complete nucleus to locate the fluorescently labeled polytene chromosomes. Scale bar, 20 µm. (b) Intensity plots along the yellow lines in (c) and (d) demonstrated the improved contrast for a higher zoom factor yielding a smaller optical sectioning thickness. (c) and (d) Magnified views of the marked region in (a) at different zoom factors. The FWHM optical sectioning thickness along z was indicated above the images. The field-of-view in (d) was limited in comparison to (a) and (c), but the image contrast was increased revealing structures, which were hidden before. The typical band structures of the polytene chromosomes as well as the Balbiani Ring transcription site (yellow arrow) became well discernible. Scale bar 10 µm. Images were taken with 20x, 0.5 NA Nikon CFI Planfluor and imaged by a iXon EMCCD-camera with a 2.5x magnifier resulting in an effective pixel size of 320 nm.