
Fig. 5.
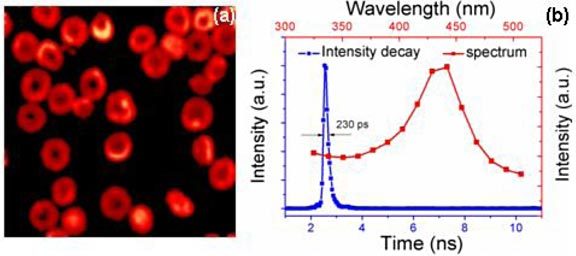
Image and fluorescence characteristics of erythrocytes at 600 nm excitation. (a) TPEF image of erythrocytes in PBS solution (The sampling area of the image: 50 × 50 um); (b) TPEF spectrum and time decay curve of erythrocytes.
Official websites use .gov
A
.gov website belongs to an official
government organization in the United States.
Secure .gov websites use HTTPS
A lock (
) or https:// means you've safely
connected to the .gov website. Share sensitive
information only on official, secure websites.
Image and fluorescence characteristics of erythrocytes at 600 nm excitation. (a) TPEF image of erythrocytes in PBS solution (The sampling area of the image: 50 × 50 um); (b) TPEF spectrum and time decay curve of erythrocytes.