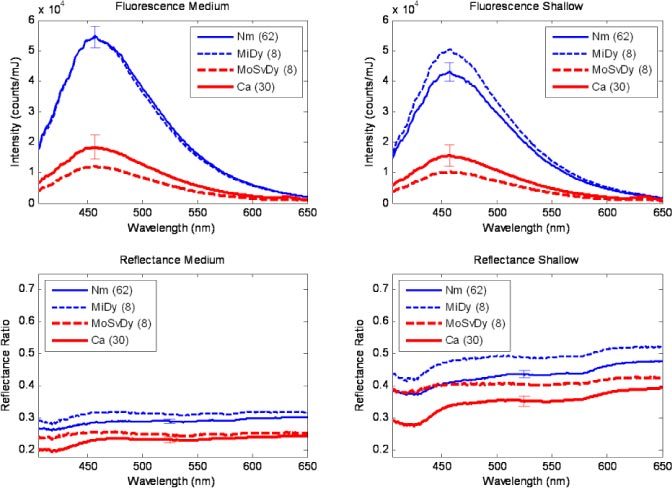
Fig. 2.

Average spectra of nonkeratinized oral sites. Nm: Normal. MiDy: Mild Dysplasia. MoSvDy: Moderate/Severe Dysplasia. Ca: Cancer. Number in parentheses indicates number of spectra represented in the average. Error bars, shown only for categories with >10 spectra, indicate standard error of the mean.
