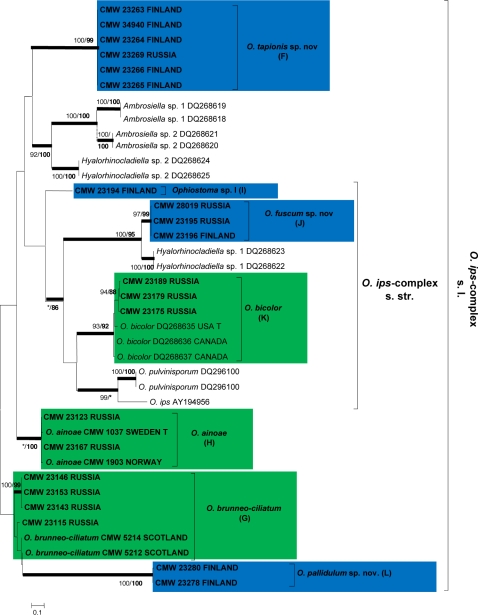
Fig. 4.
Phylogram obtained from ML analyses of the β-tubulin gene of species in the O. ips-complex s.l. Novel sequences obtained in this study are printed in bold type. ML bootstrap support values (1 000 replicates) (normal type) and MP Jackknife values (10 000 replicates) (bold type) above 75 % are indicated at the nodes. Posterior probabilities (above 90 %) obtained from BI are indicated by bold lines at the relevant branching points. * = bootstrap values lower than 75 %. T = ex-type isolates. Scale bar = total nucleotide difference between taxa. Green = known species; blue = new species.

