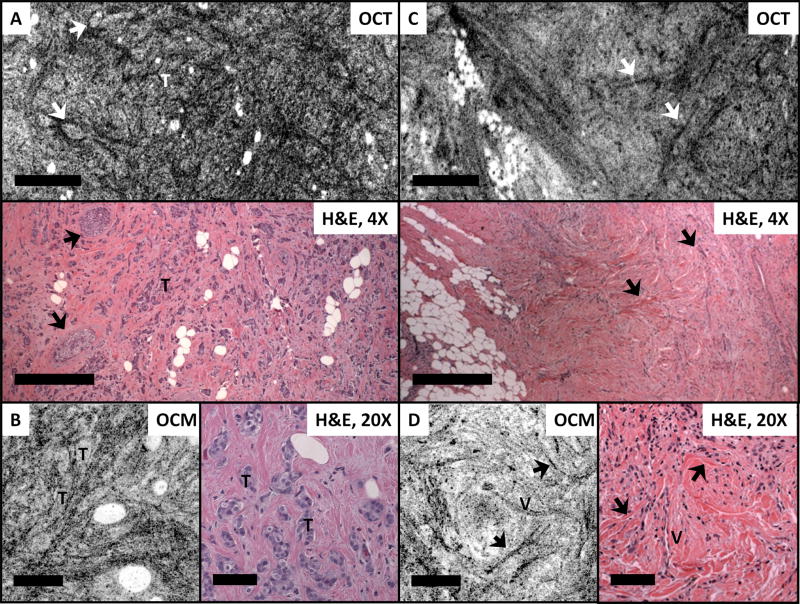
Figure 5.
OCT, OCM images and corresponding H&E histologic sections of invasive / in situ ductal carcinoma (A, B) and invasive lobular carcinoma (C, D). Arrows in A point to the DCIS involvements in invasive carcinoma. Arrows in C and D indicate stromal changes surrounding the characteristic cellular infiltration pattern of lobular carcinoma. T: tumor; V: micro vessels. Scale bars, 500 μm for OCT images and corresponding histology and 100 μm for OCM images and corresponding histology. OCT images in A and C were reconstructed from ~70 μm and ~180 μm beneath the tissue surface, respectively. OCM images in B and D were within 50 μm beneath the tissue surface.

