
Figure 2.
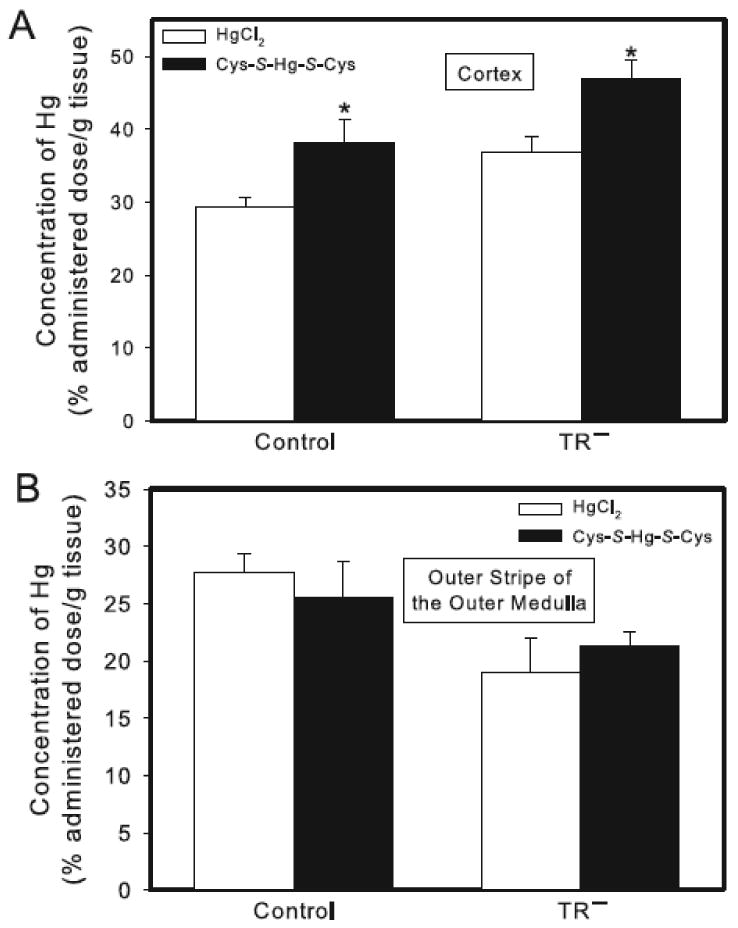
Concentration of Hg in the renal cortex and outer stripe of the outer medulla of control and TR− rats. Rats were injected (i.v.) with either HgCl2 (0.5 μmol/kg) or Cys-S-Hg-S-Cys (0.5 μmol/kg HgCl2 + 1.25 μmol/kg Cys). Panel A shows the cortical concentration of Hg. Panel B shows the concentration of Hg in the outer stripe of the outer medulla. Rats were sacrificed 24 h following injection with Hg and kidneys were harvested for estimation of Hg content. Data represent mean ± SE of four rats. * Significantly different (p < 0.05) from the corresponding mean for rats of the same strain exposed to HgCl2.