FIG. 3.
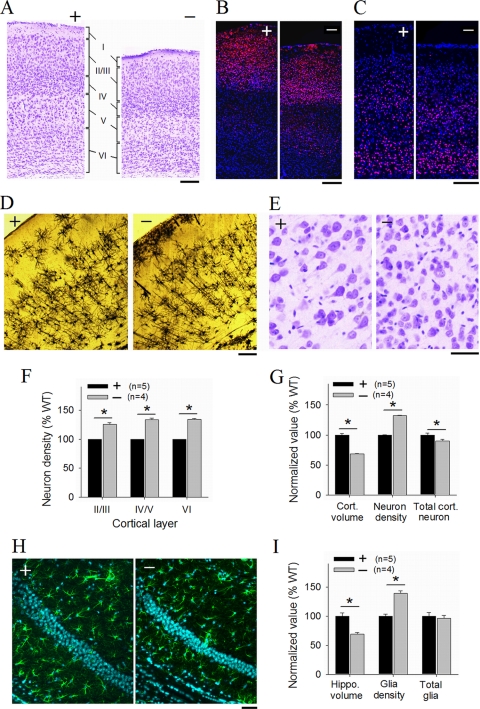
Increased neural and glial cell density in PAK1/PAK3 DK mice. (A) Cresyl violet staining of the frontal cortices showing normal cortical layers. (B, C) Cortical sections stained with the upper-layer-specific marker Cux1 (B) and the deep-layer-specific marker Tbr1 (C). (D) Golgi impregnation showing normal neuronal polarity in the frontal cortex. (E) Magnified view of cresyl violet-stained regions (layer IV, frontal cortex) revealing smaller and more densely packed neurons in the DK cortex. (F and G) Summary graphs of optical fractionator measurements, showing increased cell density in individual cortical layers (F) and in the entire cortex (G) (n = number of animals). (H) GFAP-DAPI-costained hippocampal CA1 areas showing increased cell density for both CA1 neurons and glia. (I) Summary graph of optical fractionator measurements on GFAP-DAPI-costained hippocampal sections showing reduced hippocampal volume and increased glia density without changes in total glia counts in the DK mice (n = number of animals). Scale bars, 200 μm (A to D) and 50 μm (E and H).

