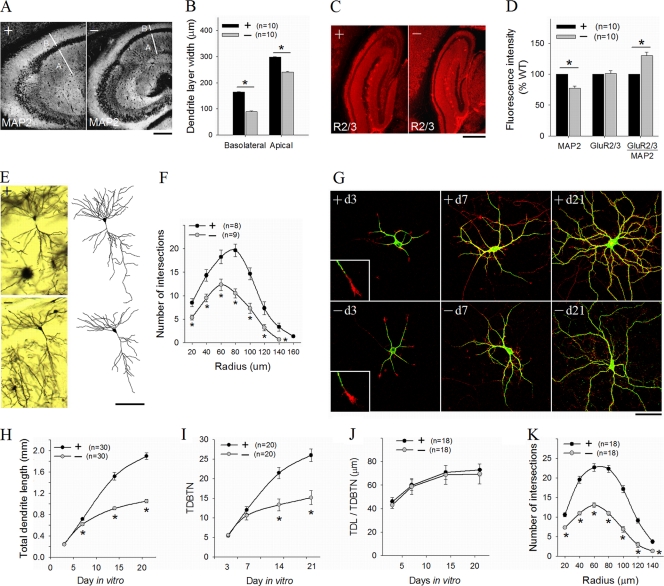
FIG. 4.
Reduced dendritic arborization in PAK1/PAK3 DK mice. (A, B) Hippocampal sections stained for the dendritic marker MAP2 (A) and summary data (B), showing reduced width for both basolateral and apical dendritic fields in the CA areas of the DK mice. Scale bar, 200 μm. (C) Hippocampal sections stained for AMPA receptor GluR2/3. Scale bar, 500 μm. (D) Summary data showing reduced fluorescence intensity for MAP2 but not for GluR2/3 in the DK mice (n = number of brain sections). (E) CA1 pyramidal neurons with Golgi impregnation (left) and camera lucida drawings (right) showing reduced dendritic complexity in the DK mice. Scale bar, 100 μm. (F) Sholl analysis of CA1 neurons, showing a reduced number of intersections across all radii (n = number of reconstructed neurons). (G) Cultured hippocampal neurons stained for MAP2 (green) and F-actin (phalloidin [red]), showing reduced dendritic complexity at DIVs 15 and 21 but not at DIV 3 and 7 in the DK mice. Scale bar, 50 μm. (H to J) Summary data of cultured hippocampal neurons at DIV 21, showing reduction in the total dendritic length (H) and total dendritic branch tip number (TDBTN) (I) but not in the average length of individual dendrites (J) in the DK mice. (K) Sholl analysis of hippocampal neurons at DIV 21 showing deficits in dendritic arborization. n = number of neurons.

