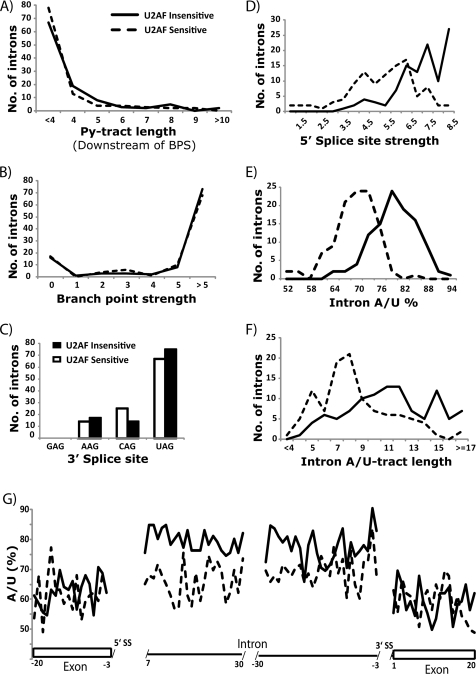
FIG. 4.
Strengths of the 5′ SS and base composition distinguish the U2AF59-sensitive (>90% unspliced) and U2AF59-insensitive introns (<10% unspliced), based on the findings shown in Fig. 1C. Histograms show comparisons between U2AF59-sensitive and -insensitive introns with respect to the following features: Py-tract length downstream of the branch site (t test, P = 0.12) (A); strength of the BPS based on consensus weight matrix scores (t test, P = 0.84) (B); the 3′ splice site sequences (P = 0.38) (C); strength of the 5′ splice site based on consensus weight matrix scores (t test, P = 1.8 × 10⁻¹⁷) (D); base composition (percent A/U) (t test, P = 1.8 × 10⁻²⁹) (E); (F) A/U tract length throughout the intron (t test, P = 4.2 × 10⁻⁹) (F); single-nucleotide distribution of the percent A/U (y axis) in the intron and flanking exon sequences, indicated by the coordinates in relation to the splice sites (G). Rectangles are exons, and the lines along the x axes are the intron.

