FIG. 3.
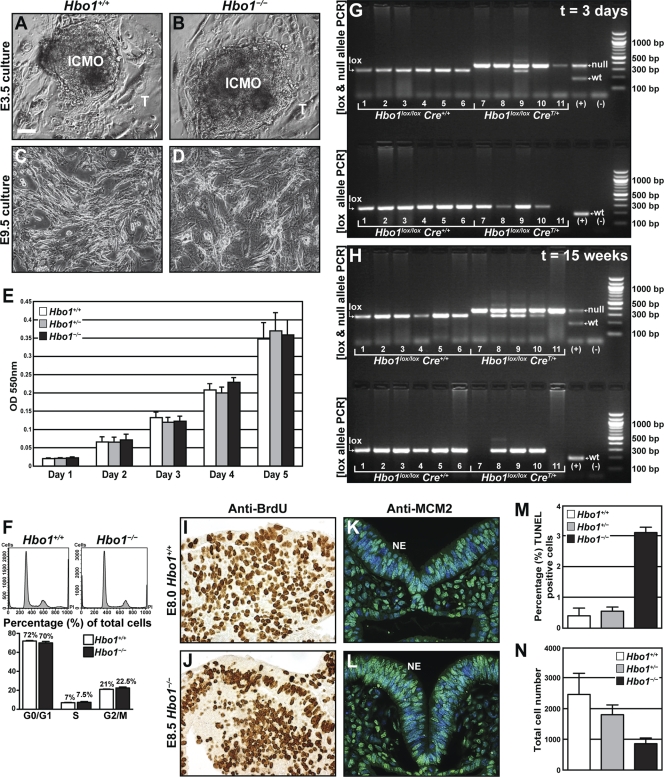
Cell proliferation and DNA replication proceeded normally in the absence of HBO1. (A and B) Hbo1−/− and Hbo1+/+ E3.5 cultures proliferated and formed normal inner cell mass outgrowths (ICMO) and surrounding trophoblasts (T) by day 7 of culture. (C and D) Normal primary embryonic fibroblasts could be derived from E9.5 Hbo1−/− and Hbo1+/+ embryos. (E) Results from MTT proliferation assay, showing no difference in proliferation between fibroblasts derived from Hbo1+/+ and Hbo1−/− embryos (P = 0.9997). OD, optical density. (F) FACS histogram of propidium iodide (PI)-stained Hbo1−/− and Hbo1+/+ PEFs, showing no significant differences in distribution of cells within G0/G1 (P = 0.302), S (P = 0.621), and G2/M (P = 0.245) phases of the cell cycle. (G) PCR amplification of DNA extracted from long-term Hbo1lox/lox Cre+/+ fibroblast lines (lanes 1 to 6) and Hbo1lox/lox CreT/+ cell lines (lanes 7 to 11) (isolated from one embryo each) on day 3 after tamoxifen treatment. As expected, only Hbo1lox/lox CreT/+ cells displayed cre deletion and the presence of the Hbo1− (null) band, whereas Hbo1lox/lox Cre+/+ cells remained undeleted, with the presence of only the Hbo1lox (lox) band. Top lanes represent DNA samples amplified for the Hbo1lox and Hbo1− allele concurrently, while bottom lanes represent the same samples amplified for the Hbo1lox allele alone. Note that sample 11 showed the presence of the Hbo1− allele but not the Hbo1lox allele, which indicates the presence of a pure population of Hbo1−/− cells. (H) PCR amplification of DNA extracted from the same samples 15 weeks and 15 passages later. Sample 11 was still proliferating normally and remained comprised entirely of deleted cells. In addition, sample 7 consisted purely of Hbo1−/− cells at this stage. (+), Hbo1+/− positive DNA control; (−), no-DNA negative control; wt, wild-type band. (I and J) BrdU immunohistochemistry, showing similar levels of BrdU incorporation in stage-matched Hbo1+/+ and Hbo1−/− embryos. (K and L) MCM2 immunofluorescence counterstained with bisbenzimide, showing similar levels and nuclear localization of MCM2 in stage-matched Hbo1+/+ and Hbo1−/− embryos. NE, neural ectoderm. (M) Percentages of TUNEL-positive cells undergoing cell death. (N) Total cell number per section. Data are presented as means ± standard errors of the means (SEM) and were analyzed as described in Materials and Methods. Bar, 94 μm (A to D) or 46 μm (I to L).

