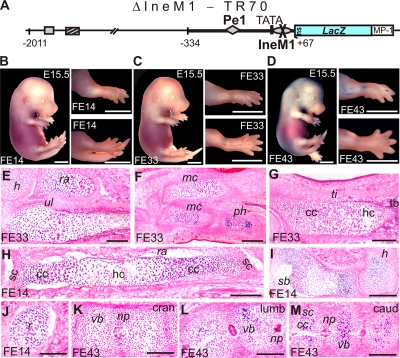
FIG. 7.
Low zonal activity of the ΔIneM1-TR70 transgene. (A to D) Schematic (A) and low activity of the transgene (B to D). (E to M) Histological analysis of cryosections. Weak X-Gal staining in the developing shoulder blade (sb) and limbs slightly increases toward phalanges (E to I). The increase is more pronounced from cranial to caudal vertebral bodies (K to M). Staining is seen in the columnar and prehypertrophic zones (G, H, and M). For other abbreviations, see the Fig. 1 legend. Bars, 2 mm (B to D) and 200 μm (E to M).

