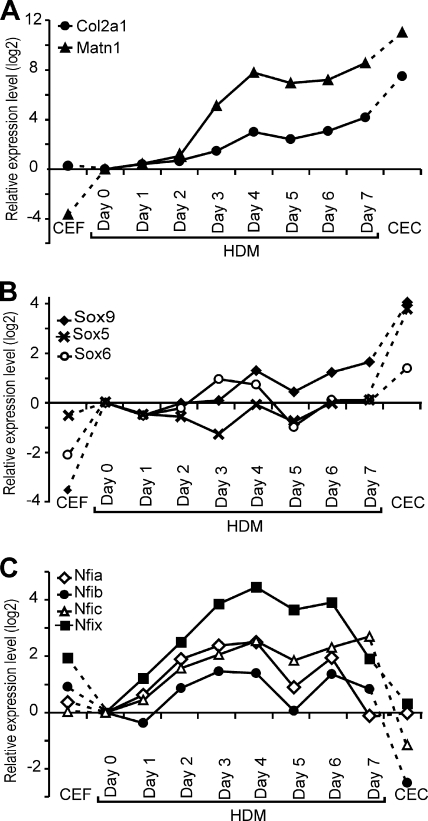
FIG. 8.
QRT-PCR analysis of marker gene expression in chondrogenic cultures. (A to C) Marker mRNA levels were determined during chondrogenesis in HDM culture at time points indicated relative to the day 0 values and compared to mRNA levels of high-expressing CEC and nonexpressing CEF cultures. CT values were normalized and relative gene expression ratios were calculated according to Materials and Methods. Relative expression levels (ΔΔCT) are plotted as log2 ratios.

