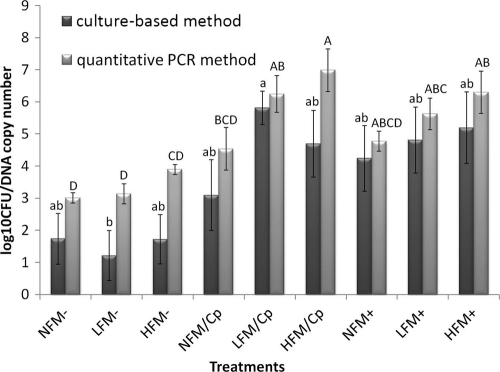
FIG. 1.
C. perfringens counts in response to experimental treatments on day 17 measured by culture and real-time PCR. The changes in the log10 values of CFU/g of C. perfringens in the treatment groups briefly showed similar patterns by real-time PCR and the culture-based method. Data are expressed as means ± standard errors (SE) (error bars) (n = 6). Treatment group abbreviations: NFM−, not fed fish meal and negative for C. perfringens and Eimeria; LFM−, fed low level of fish meal and negative for C. perfringens and Eimeria; HFM−, fed high level of fish meal and negative for C. perfringens and Eimeria; NFM/Cp, not fed fish meal and challenged with C. perfringens only; LFM/Cp, fed low level of fish meal and challenged with C. perfringens only; HFM/Cp, fed high level of fish meal and challenged with C. perfringens only; NFM+, not fed fish meal and challenged by C. perfringens and Eimeria; LFM+, fed low level of fish meal and challenged by C. perfringens and Eimeria; HFM+, fed high level of fish meal and challenged by C. perfringens and Eimeria. Bars with different letters above them correspond to values that are significantly different for culture (lowercase) and real-time PCR (uppercase) methods.

