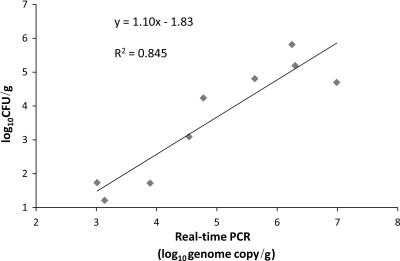
FIG. 2.
Simple linear regression of log10 DNA versus log10 CFU of C. perfringens in the birds subjected to different treatments. Data are means for six birds for each treatment group. The results for the real-time PCR method showed a high correlation with the results for the culture-based method (log10 CFU/g) (R2 = 0.845), and the regression curve had a slope of 1.10, indicating the validity of the real-time PCR method for the quantification of C. perfringens.

