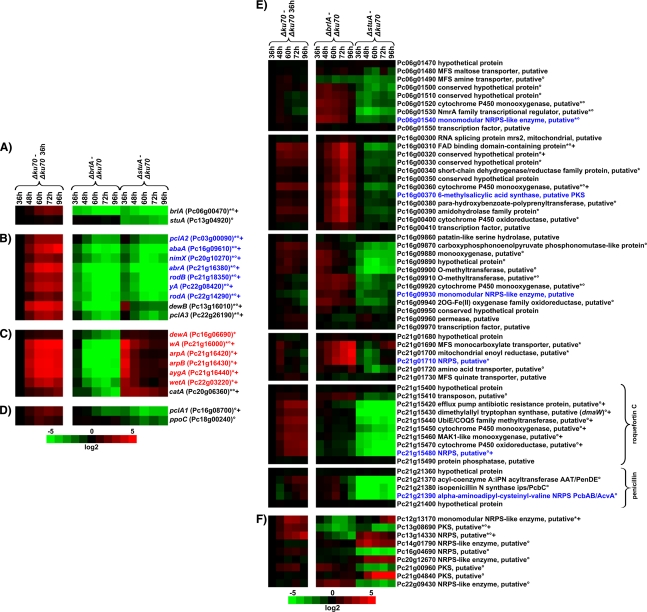
FIG. 4.
Heat map representation of the microarray analysis of ΔbrlA and ΔstuA mutants compared to the Δku70 mutant, including orthologs of genes previously implicated in conidiogenesis in A. nidulans or A. fumgatus and genes potentially involved in secondary metabolism. (A) brlA and stuA mutants. (B) Conidiogenesis-related genes downregulated in both ΔbrlA and ΔstuA mutants. (C) Conidiogenesis-related genes downregulated in the ΔbrlA mutant. (D) Conidiogenesis-related genes downregulated in ΔstuA mutant. (E) Gene clusters containing NRPS- or PKS-encoding genes deregulated in either the ΔbrlA or the ΔstuA mutant or both. (F) Individual NRPS- or PKS-encoding genes deregulated in either the ΔbrlA or ΔstuA mutant. The left column displays the time course expression in the Δku70 mutant, with all values normalized to the respective 36-h value; +, genes upregulated ≥3-fold at three or more consecutive time points compared to results at the 36-h time. The right column displays the change in transcript levels in ΔbrlA and ΔstuA mutants, respectively, normalized to the same time point as the Δku70 mutant. Values are shown in log 2 scale in green for downregulation and red for upregulation. * and °, genes deregulated ≥3-fold at three or more consecutive time points compared to Δku70 in ΔbrlA and ΔstuA strains, respectively. abaA coregulated and wetA coregulated genes are shown in blue and red, respectively. Gene clusters were regarded as deregulated when three or more genomically neighboring genes were ≥3-fold deregulated at three or more consecutive time points; gaps of single less-regulated genes were allowed for three or more neighboring genes; the heat map representation of regulated gene clusters includes the flanking unregulated genes. NRPS and PKS in panel E are shown in blue.

