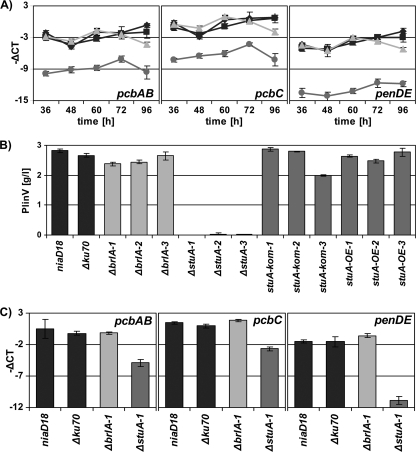
FIG. 5.
Penicillin biosynthesis by ΔbrlA or ΔstuA. (A) qRT-PCR analysis of the expression of penicillin biosynthetic genes in a time course experiment. (B) Quantification of PENV production by HPLC analysis. Mean values ± standard deviations are derived from biological sextuplicates. (C) qRT-PCR analysis of the expression of the penicillin biosynthetic genes in panel B. The results are given as means ± standard deviations of three independent biological with three technical triplicates. Black diamonds, niaD1; black squares, Δku70; light gray triangles, ΔbrlA; medium gray circles, ΔstuA.

