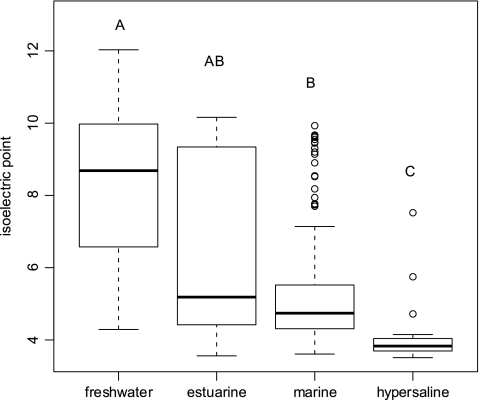
FIG. 4.
Box plot illustrating the distribution of predicted chitinase isoelectric points at different salinity ranges. Values exceeding 1.5 times the interquartile range are indicated individually as circles. The same letters above the box plots indicate no significant difference (P > 0.05) between the tested habitats if identical and significant differences (P < 0.002) if distinct. Differences in the isoelectric points among the habitats were tested for significance by applying a randomized one-way ANOVA (10,000 iterations) with post hoc comparisons (Holm's correction).

