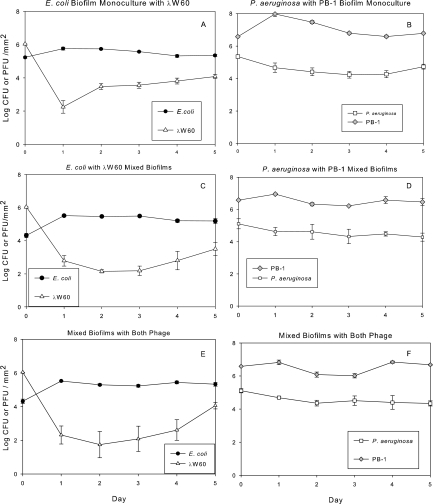
FIG. 3.
Monoculture and mixed-culture E. coli and P. aeruginosa biofilm density in the presence of phages λW60 and PB-1. (A) E. coli and λW60 in monoculture biofilms. (B) P. aeruginosa and λW60 in monoculture biofilms. (C) Mixed-culture E. coli and P. aeruginosa in the presence of λW60. (D) Mixed-culture E. coli and P. aeruginosa in the presence of PB-1. (E) Mixed-culture E. coli and λW60 in the presence of both phages. (F) Mixed-culture P. aeruginosa and PB-1 in the presence of both phages. Values (±SE) depict log10 CFU mm−2 for bacteria and log10 PFU mm−2 for phages.

