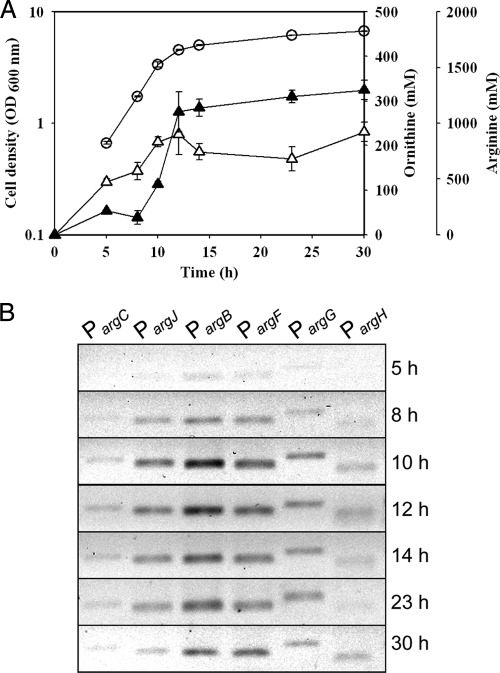
FIG. 5.
Time profiles of in vivo DNA binding of ArgR. (A) Cell growth and ornithine and arginine production during cultivation of C. glutamicum. Cell growth is indicated by circles, and ornithine and arginine concentrations are indicated by open and closed triangles, respectively. The results are reported as the means ± standard deviations (SD) (n = 3). (B) In vivo binding of FarR to individual promoter regions of arg genes analyzed by ChIP assays. The C. glutamicum wild-type strain was treated with formaldehyde to cross-link FarR to promoters and lysed, and FarR complexes were immunoprecipitated for analysis.

