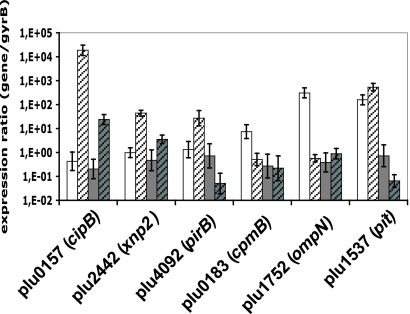
FIG. 1.
qRT-PCR data on six genes displaying lower transcription in TT01α than in VAR*. qRT-PCR was carried out with total RNA from TT01α (white bars) and VAR* (gray bars) variants in the growth exponential phase (plain bars) and the stationary phase (hatched bars). The specific internal primers for each gene are listed in Table 2. The data are presented as a ratio, with gyrB used as the control gene. Values are means of six assays (three technical replicates on each biological replicates) and were compared using a Student t test (P > 0.05). The confidence limits are shown.

