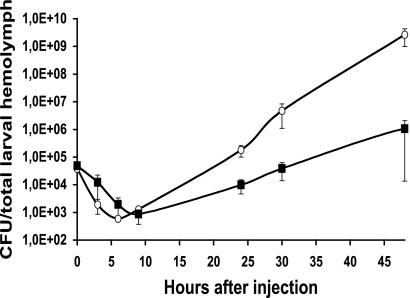
FIG. 3.
Bacterial growth after the injection of TT01α (○) and VAR* (▪) into S. littoralis. The graphs show the mean numbers of CFU recovered from the total hemolymph of single larvae (four larvae per time point). Larvae were each injected with 5 × 10⁴ bacteria at time zero. Errors bars indicate the standard errors of the means.

