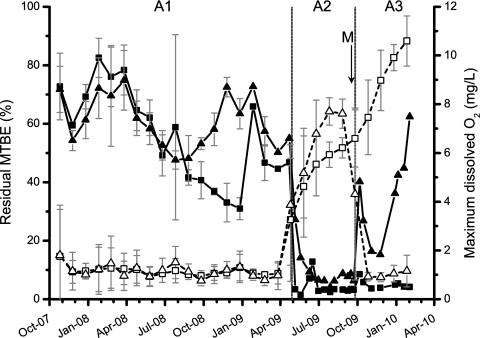
FIG. 1.
Residual MTBE percentages (solid symbols) and maximum dissolved oxygen concentrations (open symbols) at the outflow section in the two parallel basins with CO (squares) and PO (triangles) materials along the three different aeration periods (A1, A2, and A3). The oxygen data and the MTBE residual data are given in monthly averages (± standard deviations [SD]) during the A1 period, as described previously (20). The rest of MTBE sampling times (normally 2 to 3 times a month) are all represented. The biofilms for the studied microcosm experiments (M) and RNA extraction were sampled at the end of period A2 (5 October 2009).

