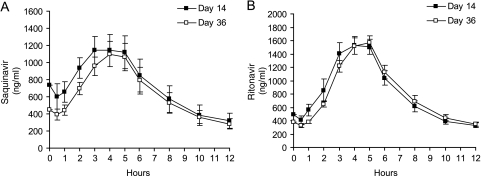
FIG. 1.
Mean plasma drug concentration-time profiles of saquinavir (A) and ritonavir (B) on day 14 (saquinavir-ritonavir [1,000 mg of saquinavir and 100 mg of ritonavir] twice daily) and on day 36 (saquinavir-ritonavir [1,000/100 mg] BID and rifabutin [150 mg] every 3 days) for group 1 (pharmacokinetic data for 19 subjects for both day 14 and day 36). The error bars represent the standard errors of the means.

