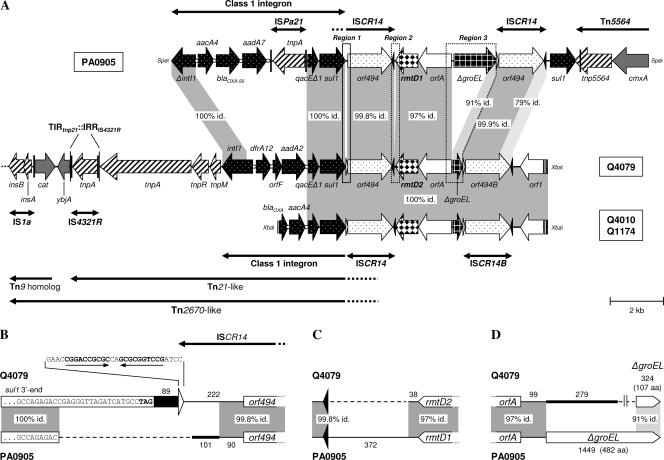
FIG. 1.
Schematic representation of the genetic platform of rmtD2. (A) Comparison of the fragments harboring rmtD2 in E. aerogenes Q4079 and C. freundii Q1174 or E. cloacae Q4010 with the genetic environment of rmtD1 in P. aeruginosa PA0905 (5). The gray-shaded areas indicate nucleotide identity. Regions 1, 2, and 3 (framed by dotted lines), which included key differences between both genetic platforms, are depicted in more detail in panels B, C, and D, respectively. The broad horizontal arrows indicate genes and their transcriptional orientations. The attI and attC sites of class 1 integrons are symbolized by open circles. The black and white triangles represent oriIS and terIS, respectively. The thick lines with single or double arrowheads indicate the insertion elements (ISs) and transposons found (black vertical bars show inverted repeats [IRs]). (B) Region 1. A gap (dashed line) was introduced to maximize the alignment, and the numbers (nucleotides) indicate fragment lengths. The last nucleotides of sul1 are shown for each class 1 integron (sequences are not to scale). The black bar and the thick line indicate the sequences downstream to sul1, i.e., the end of the 3′ conserved sequence (3′CS) and a sequence without significant similarity in GenBank, respectively. The white triangle represents the terIS found only in E. aerogenes Q4079, and its sequence is shown (arrows indicate IRs). (C) Region 2. The dashed line and numbers are described for panel B. The black triangles represent oriISs. (D) Region 3. The dashed line and numbers are described for panel B. The thick line indicates a sequence without significant similarity in GenBank. ΔgroEL genes are not to scale, and the number of amino acids (aa) of each putative encoding protein is shown.

