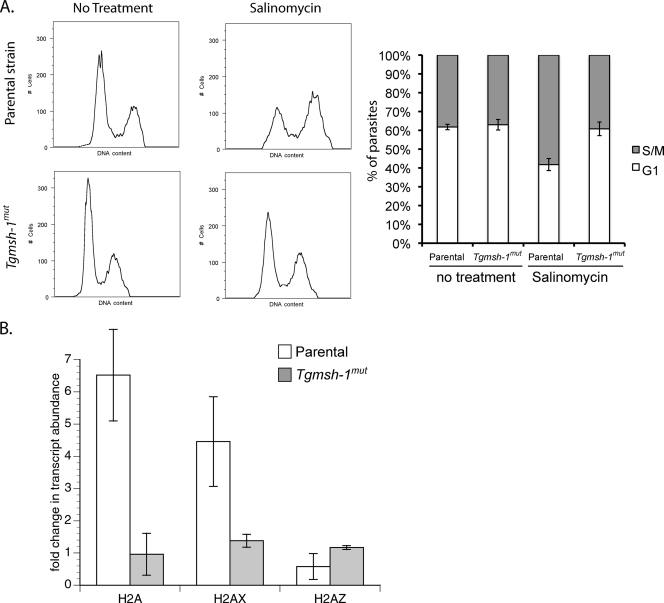
FIG. 4.
Effect of salinomycin on T. gondii cell cycle and histone transcription. (A) Flow cytometry analysis of parental (RH) and TgMSH1-deficient (Tgmsh-1mut) T. gondii in response to salinomycin. Intracellular parasites were exposed to either normal culture medium or culture medium plus 15 ng salinomycin/ml for 24 h. DNA content was measured using Sytox green. Representative histograms are shown. Each histogram represents 10,000 total events. Percentage ± standard deviation of parasites in G1 or S/M phases determined by gating for three separate experiments is indicated in the accompanying bar graph. (B) Real-time quantitative PCR (RT-qPCR) showing changes in transcript abundance for the canonical histone subunit H2A and the variant subunits H2AX and H2AZ after exposure to salinomycin (15 ng/ml, 24 h) in both RH and Tgmsh-1 mutant strains. Each bar represents the mean value for three independent replicates. Error bar = 1 standard deviation.

