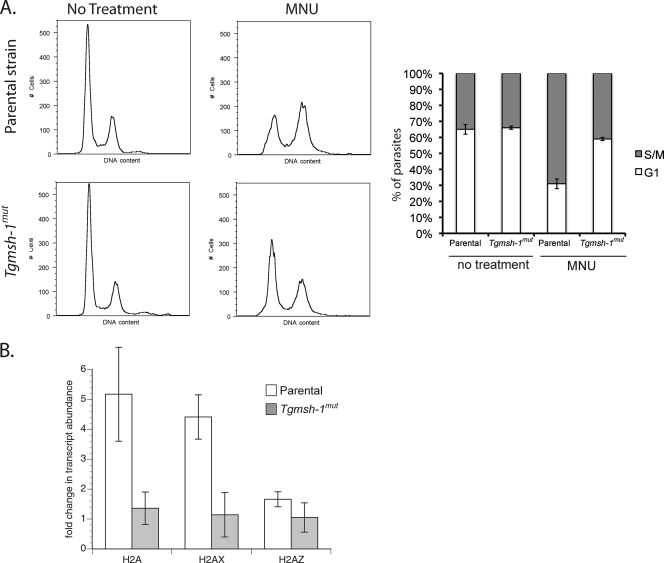
FIG. 5.
Effect of MNU on T. gondii cell cycle distribution and histone transcription. (A) Flow cytometry analysis of RH and Tgmsh-1 mutant strains in response to MNU (1 mM, 24 h). Percentage ± standard deviation of parasites in G1 or S/M phases determined by gating for three separate experiments is indicated in the accompanying bar graph. (B) RT-qPCR showing effects of MNU (1 mM, 24 h) on transcription of histone subunits H2A, H2AX, and H2AZ. Each bar represents the mean value for three independent replicates. Error bar = 1 standard deviation.

