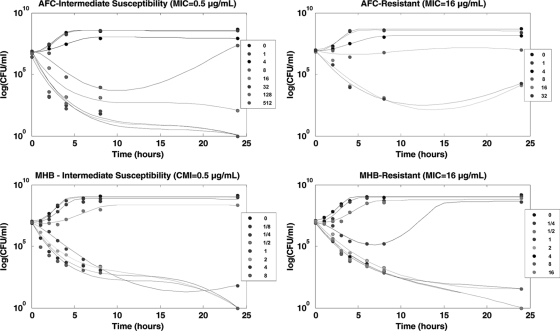
FIG. 2.
Bacterial counts of E. coli exposed to marbofloxacin and the time-kill curves predicted by the model for strains of intermediate susceptibility (MIC of 0.5 μg/ml) and for resistant strains (MIC of 16 μg/ml) under AFC and MHB conditions. Concentrations are given in terms of the MIC of the corresponding strain.

