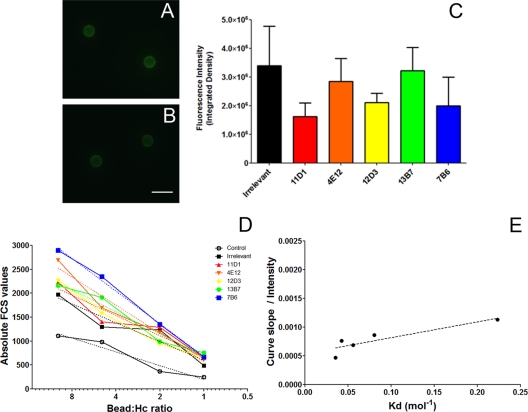
FIG. 3.
Characterization of the agglutination efficacy of MAbs by flow cytometry. (A and B) Immunofluorescence of MAb-coupled beads displays an intensity of fluorescence similar to that of the IgG isotype control (A) and MAb 12D3 (B). Fluorescence with MAb 12D3 is representative of the fluorescence produced by incubation with each of the MAbs to Hsp60. Scale bar = 5 μm. (C) Fluorescence intensity of the beads as measured by ImageJ. (D) Agglutination of H. capsulatum (Hc) was measured with different bead/yeast ratios, and the slope of the curves is considered the agglutination efficacy. (E) When the slope was normalized by fluorescence intensity on the beads, to calculate the agglutination constant of the MAbs, a correlation with the dissociation constant (Kd) values was observed, obtained by inhibition ELISA. The experiments depicted were repeated three times in duplicate.

