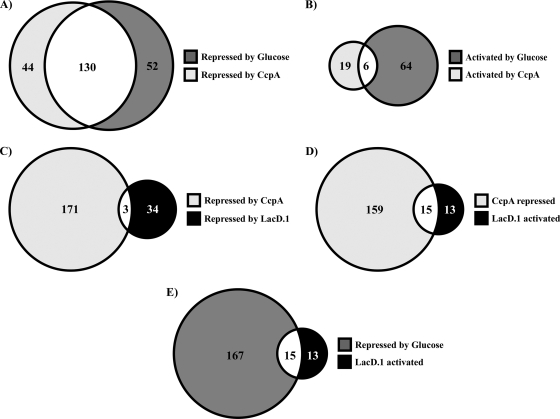
FIG. 1.
Overlap between CcpA, LacD.1, and glucose transcriptional profiles. The Venn diagrams show the common and unique transcripts in different modes of regulation by CcpA, LacD.1, and glucose. (A) Numbers of transcripts repressed by glucose and CcpA (decreased abundance in wild-type [HSC5] bacteria grown with glucose; increased abundance in CcpA− [CKB206] bacteria). (B) Numbers of transcripts activated by glucose and CcpA (increased abundance in bacteria grown with glucose; decreased abundance in CcpA− bacteria). (C) Numbers of transcripts repressed by CcpA and LacD.1 (increased abundance in CcpA− and LacD.1− [JL141] bacteria). (D) Numbers of transcripts repressed by CcpA and activated by LacD.1 (increased abundance in CcpA− and decreased abundance in LacD.1− bacteria). (E) Numbers of transcripts repressed by glucose and activated by LacD.1 (decreased abundance in wild-type bacteria grown in glucose; decreased abundance in LacD.1− bacteria). The numbers given are the total numbers of transcripts for which the changes in abundance were found significant (P < 0.05) by ANOVA as described in Materials and Methods.

