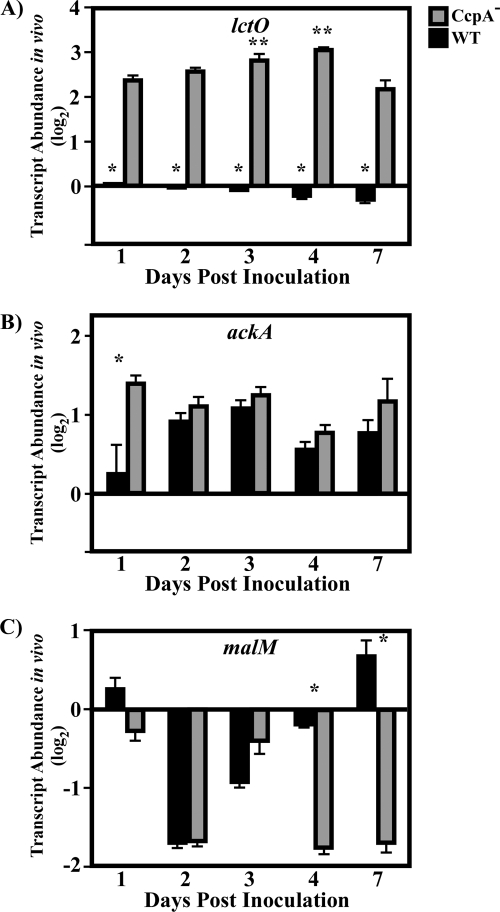
FIG. 4.
Analysis of transcript abundance over time for CcpA- and glucose-repressed genes. After the sizes of the lesions were documented (Fig. 4), mice were sacrificed, and total RNA was purified from lesions. The RNA was then reverse transcribed and subjected to RT-PCR analysis using the primers listed in Table S1 in the supplemental material. Data are presented as the ratio of the value for the indicated gene from the CcpA− (CKB206) or wild-type (WT) (HSC5) strain at the indicated time point to the value for the WT strain on day 1 postinfection. Differences between mean values were tested for significance using Student's t test. The data presented are means and standard errors of the means from two independent experiments in which three replicates per experimental group were analyzed in triplicate. (A) Asterisks indicate significant differences (*, P < 0.0001; **, P < 0.01) from the transcript abundance for the CcpA− strain on other days. (B) *, P < 0.0008. (C) *, P < 0.0001.

