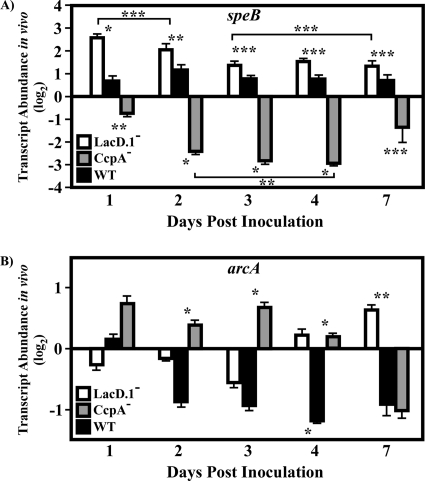
FIG. 7.
Analysis of CcpA- and LacD.1-coregulated genes over time. Samples were treated as explained in the legend to Fig. 4. Data are presented as the ratio of the value for the indicated gene from the CcpA− (CKB206), LacD.1− (JL141), or wild-type (WT) (HSC5) strain at the indicated time point to that for the WT strain on day 1 postinfection. Differences between mean values were tested for significance using Student's t test. The data presented are means and standard errors of the means from two independent experiments in which three replicates per experimental group were analyzed in triplicate. (A) *, P < 0.0001; **, P < 0.001; ***, P < 0.05. Brackets indicate groups that are significantly different from each other. (B) *, P < 0.0001; **, P = 0.0116.

