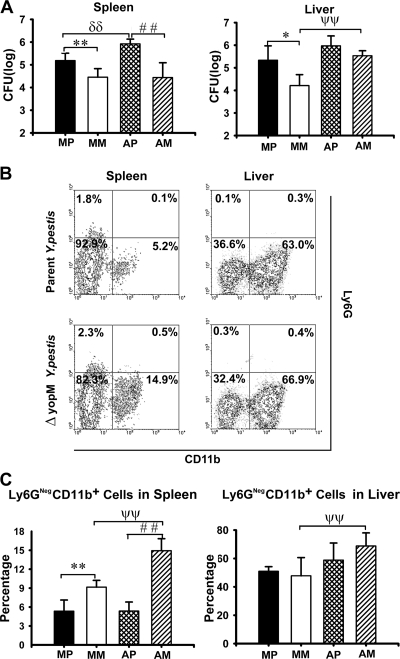
FIG. 2.
Effect of PMN ablation on infection dynamics for ΔyopM and parent Y. pestis KIM5. Mice were treated with rat anti-Ly6G antibody to ablate PMNs, and control animals were mock treated with irrelevant (nonspecific) rat IgG on days −1 and +1 of infection. The mice were infected and analyzed as described in the legend for Fig. 1 for bacterial burdens and inflammatory leukocyte populations in livers and spleens on day 3 p.i. MP, mock-treated mice infected with parent Y. pestis; MM, mock-treated mice infected with the ΔyopM mutant; AP, PMN-ablated mice infected with the parent; AM, PMN-ablated mice infected with the ΔyopM mutant strain. (A) CFU. (B) Flow cytometric scatter plots illustrating the discrimination of populations of live leukocytes in anti-Ly6G-treated mice for the presence of Ly6G and CD11b surface markers. Representative data are shown for leukocytes from liver and spleen of individual mice infected with parent or ΔyopM Y. pestis (day 3 p.i.). The percentage of total live leukocytes contained in each quadrant is given. (C) Ly6G− CD11b+ cells (MOs, Mφs, and myeloid DCs) expressed as percentage of total live leukocytes. In panels A and C, each datum point represents the average of values from 6 mice. The error bars indicate the standard deviations. In comparisons between PMN ablation and mock ablation groups, ψψ, P < 0.01 for mice infected with the ΔyopM strain; δδ, P < 0.01 for mice infected with the parent strain. In comparisons between groups of mice infected with the parent and the ΔyopM strains, *, P < 0.05, and **, P < 0.01, for mock-treated mice; # #, P < 0.01 for PMN-ablated mice.

