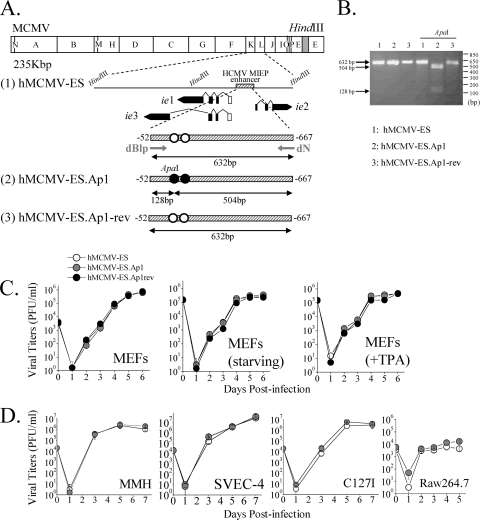
FIG. 6.
Construction and in vitro growth analysis of parental hMCMV-ES, hMCMV-ES.Ap1, and hMCMV-ES.Ap1-rev viruses. (A) Schematic illustrations of the parental hMCMV-ES, hMCMV-ES.Ap1, and hMCMV-ES.Ap1-rev genomes. The HindIII map of the parental MCMV genome is given at the top with the BAC sequences represented by a gray box. The enlarged map below (line 1) represents the MIE locus of the hMCMV-ES genome, carrying a 616-bp fragment (shaded rectangle) corresponding to the HCMV MIEP enhancer replacing the MCMV enhancer, with the structure of the MIE transcripts (ie1, ie2, and ie3). Coding and noncoding exons are depicted as black and white boxes, respectively. AP-1 sites are indicated in white. In hMCMV-ES.Ap1 (line 2), the AP-1 binding sites within the enhancer were mutated (black circles). A unique ApaI restriction site, introduced when the MIEP AP-1−174 recognition site was altered, is indicated. In hMCMV-ES.Ap1-rev (line 3), the native HCMV enhancer sequences were reintroduced in hMCMV-ES.Ap1 in replacement of the mutated HCMV enhancer. The sizes of the expected PCR-amplified fragments with primers dN and dBlp (marked by arrows) flanking the MIEP enhancer before and after ApaI treatment are indicated. Coordinates are given relative to the HCMV ie1/ie2 transcription start site. The illustration is not drawn to scale. (B) To verify the appropriate mutagenesis of the AP-1 sites, enhancer sequences were amplified from hMCMV-ES (lanes 1), hMCMV-ES.Ap1 (lanes 2), and hMCMV-ES.Ap1-rev (lanes 3) viruses by PCR using dN and dBlp primers. The amplified products were digested with restriction enzyme ApaI. Shown are the amplified products separated on a 2% agarose gel before and after ApaI treatment. Size markers are shown at the right, and product sizes are shown at the left. (C) Growth kinetics of hMCMV-ES.Ap1 and control viruses in MEFs under different conditions. MEFs were infected at an MOI of 0.025 PFU/cell with hMCMV-ES, hMCMV-ES.Ap1, and hMCMV-ES.Ap1-rev viruses in DMEM-3% FBS, under starvation conditions (DMEM-0.5% FBS), or in the presence of TPA, as indicated. At the designated days p.i., cell supernatants were collected and titrated on MEFs. (D) Replication of hMCMV-ES.Ap1 in different cell types. MMH cells, SVEC-4 cells, and C127I cells were infected at an MOI of 0.025, and RAW 264.7 cells were infected at an MOI of 0.1, with hMCMV-ES and hMCMV-ES.Ap1. The level of infectious virus present in culture supernatants at the designated days p.i. was determined. Each data point represents the average and standard deviation of three separate cultures.

