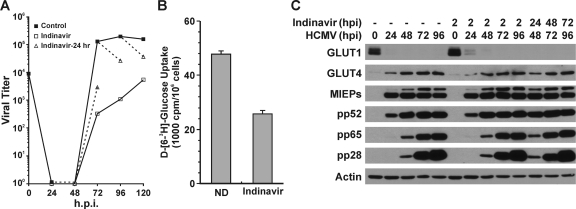
FIG. 6.
Inhibition of GLUT4 by indinavir results in reduced HCMV growth. (A) Indinavir inhibits production of infectious HCMV virions. HCMV virus growth curves were generated in the presence of indinavir or water (drug solvent, Control). HFs were infected with HCMV as described in the text. The black line with solid squares indicates the control growth curve in which water was added at 2 hpi. The black line with open squares indicates the indinavir-treated cultures where 200 μM indinavir was added at 2 hpi and staged in the infection until harvesting. The dashed line with open triangles indicates that indinavir was added for 24 h prior to harvest, i.e., 24 to 48, 48 to 72, 72 to 96, or 96 to 120 hpi. (B) Glucose uptake was inhibited by indinavir in HCMV-infected cells. Glucose uptake was measured in HCMV-infected cells in the presence or absence of 200 μM indinavir as described in Materials and Methods. ND, no drug. (C) Virus protein levels in control and indinavir-treated cultures. Whole-cell extracts were prepared from HCMV-infected cultures treated with indinavir as described for panel A and evaluated by Western analysis.

